How is river health measured? Reading the official ratings
Regulators grade waters from high to bad using fish, plants, invertebrates and water chemistry. One failing test pulls down the whole grade, which is why the headline figures look so bleak.
By the editorsPublished Sources checked 8 November 2026

The usual measure is a grade called ecological status, running through five classes: high, good, moderate, poor and bad. In England the Environment Agency combines assessments of individual elements such as fish, plants, invertebrates and water quality. In its 2025 results, published on 6 August 2026, 14.3% of the 4,658 surface water bodies assessed reached good ecological status. That covers more than rivers, and the figure needs some reading before it means much.
| Class | Share of water bodies |
|---|---|
| High | 0.1% |
| Good | 14.3% |
| Moderate | 65.4% |
| Poor | 17% |
| Bad | 3.1% |
Source: Environment Agency, via GOV.UK, August 2026. Figures as published; they sum to 99.9%.
One out, all out
The rule behind the grade explains much of the gloom. To reach good status, every assessed element has to meet the standard for good or better. If one falls short, the overall classification falls with it. The Environment Agency's example is the River Foss, which is good on every indicator except phosphate. Phosphate is moderate, so the Foss is moderate overall.
About a third of the water bodies that failed did so because of a single element. Look one layer down and things appear less stark: 82% of individual ecological indicators are good or high, and ammonia reaches good or better in 92.9% of cases. Both ways of looking at it are true. The overall grade tells you whether a water passes all its tests at once, while the indicator figures tell you how many individual tests are passed.
Why you cannot simply compare with 2019
The 2019 figure was 16.3%, so it is tempting to say things got worse. The Environment Agency says that the two figures are not directly comparable, because methods have changed. It automated the assessment of heavily modified water bodies, updated baselines and removed older classifications based on expert judgement. A lower grade can reflect a better understanding of a river rather than a decline in it. The agency also describes classifications as a snapshot that should not be used alone to show a long-term trend.
Chemical status is a separate story
Chemical status is reported apart from ecological status, and all surface waters in England fail it. The agency attributes this to persistent legacy substances, including brominated flame retardants, mercury and PFOS, which will take decades to deplete. So a universal fail tells you little about the difference between your stream and the next one. The ecological grade and its individual elements are more useful for that.
Why the Rivers Trust's figures look different
You will also see numbers from the Rivers Trust's State of Our Rivers reporting, whose 2026 report covers the UK and Ireland. Its page says that none of England's almost 4,000 river stretches are in good or high overall health, that 22% are in poor or bad overall health, and that 15% of stretches reach good or high ecological status. The government's 14.3% counts all surface waters. The Trust's figures concentrate on river stretches, and its 0% refers to overall health rather than ecological status alone. Before quoting any of these, check which waters and which measure they refer to.
The Trust also names the pressures in plainer language than a status table does, and sets out how climate change adds to them. The government's release mentions sewage spills, agricultural nutrients, and urban and transport run-off as factors affecting water quality, without giving a share for each.
Sewage overflows: a different kind of measure
Storm overflow data counts events rather than ecological condition. Every storm overflow in England now has an event duration monitor, and the Environment Agency reported 291,492 spill events for 2025, down 35% on 2024, with total duration down 48% and an average of 20.5 spills per overflow compared with 31.8. The agency says much of that reflects a drier 2025 after a wet 2024, so rainfall heavily influences the numbers, and a single year's fall does not establish a trend.
Two free maps let you look locally. The Environment Agency's Storm Overflow Explorer displays the annual returns from water companies. The Rivers Trust's Sewage Map adds near real-time alerts for England and Scotland. If you see a spill yourself, use the lines in our guide to reporting river pollution.
Checking your own river
The Environment Agency explains its results on its Understanding England's Water Environment pages, with explainers and FAQs. It says the 2025 results will not reach its catchment data explorer until late December 2026, and until then that tool shows the 2019 results. Remember this if you look up a river there this winter. Scotland, Wales and Northern Ireland have their own regulators and publish separately, so go to SEPA, Natural Resources Wales or the Northern Ireland Environment Agency for rivers outside England.
Counting riverflies: how volunteers help
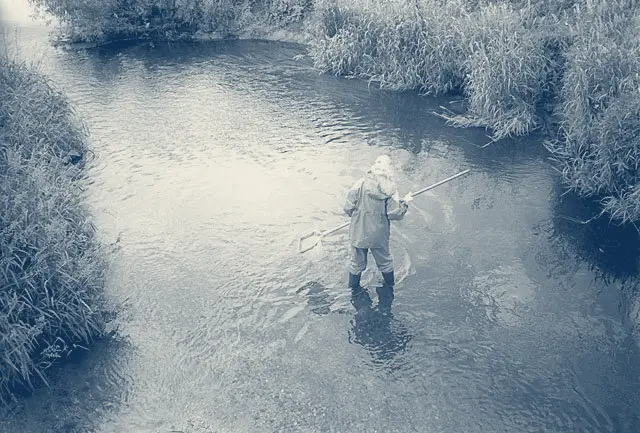

Official sampling cannot watch every stretch all the time. The Riverfly Monitoring Initiative trains anglers and community groups to use a simple, standardised technique that looks for severe changes in water quality. Volunteers count eight groups of pollution-sensitive invertebrates, and groups deal directly with a local contact at the Environment Agency, or the equivalent at SEPA, NRW or NIEA. Verified data is free to view and download.
No qualifications or experience are needed, though monitors must be at least 18 and physically able to get into a river. The Partnership's FAQ says to email [email protected] with the area you would like to monitor. Training days run mostly in spring and summer, and you can register interest at any time. Standing in a river in waders also makes you a useful set of eyes for water vole and otter signs and for the invasive plants and animals covered elsewhere on this site.